




Restaurants Now Outnumber Pubs in the UK for the First Time
There were 38,735 licensed restaurants and 37,350 pubs in the UK in March 2026. It’s the first time restaurants have come out ahead in figures going back to 2010.
Business sites classed as pubs and bars (SIC 56302) and licensed restaurants (SIC 56101), UK, March of each year. Hover over a point to see the figure for that year. Source: ONS UK Business Counts via Nomis. ONS widened its business register in 2015, so years before 2015 aren’t directly comparable with later ones.
Pubs were almost 17,000 sites ahead in 2010
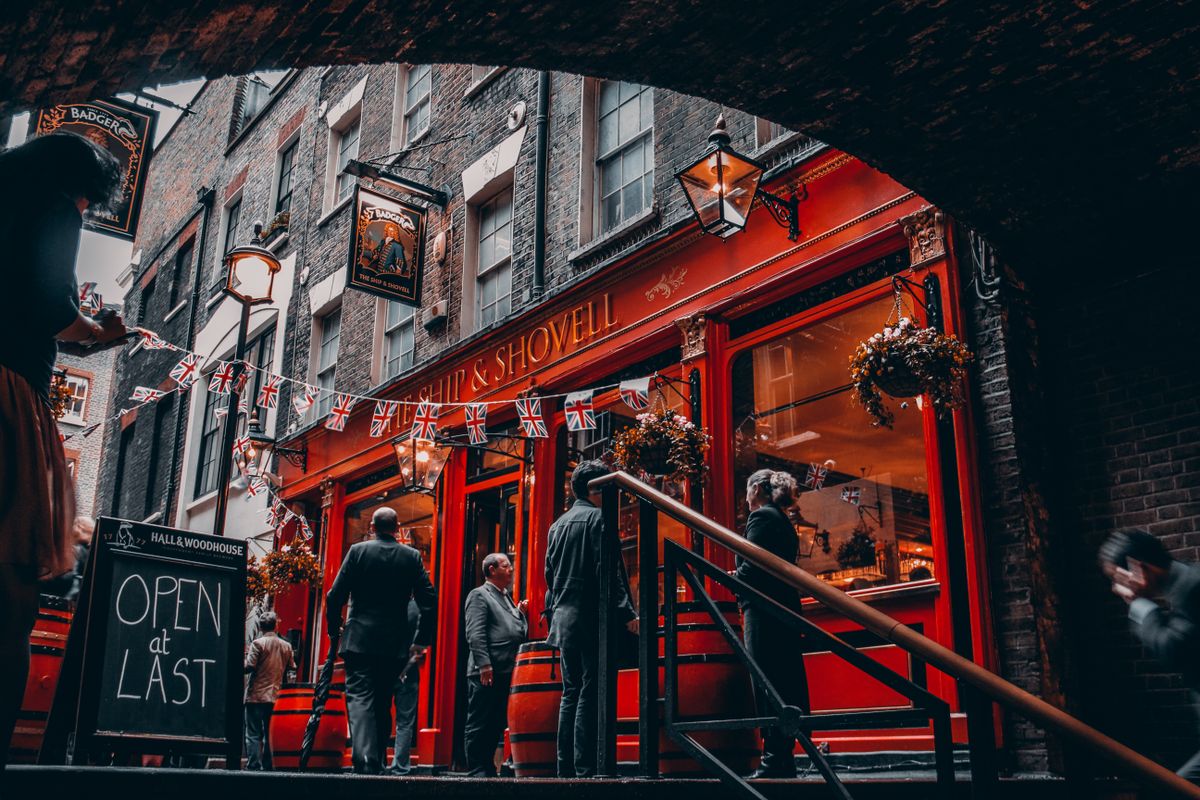
In 2010 the UK had 44,680 pubs and 27,885 licensed restaurants. Over the next 16 years, pub numbers fell in 14 of them. Restaurant numbers rose in 12.
By March 2025 the gap was down to 505. In the following 12 months the UK lost 455 pubs and gained 1,435 restaurants, and the lines crossed.
Pubs and licensed restaurants, UK, selected years
Select a column heading to sort.
| 2010 | 44,680 | 27,885 | −16,795 |
|---|---|---|---|
| 2015 | 40,360 | 31,950 | −8,410 |
| 2019 | 39,145 | 35,105 | −4,040 |
| 2024 | 37,875 | 37,015 | −860 |
| 2025 | 37,805 | 37,300 | −505 |
| 2026 | 37,350 | 38,735 | +1,385 |
“Pubs have been closing for years, so the decline isn’t the surprise. The surprise is that restaurants have finally overtaken them.
People used to drop into the pub on the way home. Now a night out is something they plan and book, and when they do, they tend to choose somewhere to eat.”
Steven ForesterSales Manager, Homefords
London tips the balance
The UK total hides a split. Restaurants outnumber pubs in three regions: London, Scotland and the South East. In the East the two are level, with 3,260 restaurants and 3,270 pubs.
London has 264 restaurants for every 100 pubs. It also accounts for almost a third of the UK’s restaurant growth since 2019, adding 1,165 of the 3,630 new sites.
Outside London, pubs still lead by 33,725 to 29,175. Yorkshire and The Humber is the most pub-heavy region, with 68 restaurants for every 100 pubs.
Licensed restaurants for every 100 pubs, by region, 2026
Scotland and Wales are losing pubs fastest
Between 2019 and 2026, pub numbers fell in 11 of the 12 UK regions. Scotland lost 315 pubs, a fall of 11%. Wales lost 185, a fall of 8.4%.
London is the exception. It gained 75 pubs over the same period, a rise of 2.1%.
Change in pubs and bars by region, 2019 to 2026
Restaurants are growing in 11 of 12 regions
Wales has the fastest restaurant growth, up 16.3% since 2019. It’s also losing pubs faster than any region except Scotland.
The North West and London follow, both up 14%. Northern Ireland is the only region where licensed restaurant numbers fell, down 4.1% to 695.
Change in licensed restaurants by region, 2019 to 2026
How does your region compare?
Pick a region to see how its pubs and restaurants have changed since 2019.
Choose a region above to see its figures.
Every region, side by side
| Pubs and bars | Licensed restaurants | ||||||
|---|---|---|---|---|---|---|---|
| North East | 1,700 | 1,655 | −2.6% | 1,085 | 1,215 | +12.0% | 73 |
| North West | 4,535 | 4,460 | −1.7% | 3,275 | 3,735 | +14.0% | 84 |
| Yorkshire and The Humber | 3,705 | 3,670 | −0.9% | 2,290 | 2,510 | +9.6% | 68 |
| East Midlands | 3,210 | 3,005 | −6.4% | 1,870 | 2,095 | +12.0% | 70 |
| West Midlands | 3,515 | 3,340 | −5.0% | 2,225 | 2,340 | +5.2% | 70 |
| East | 3,495 | 3,270 | −6.4% | 3,000 | 3,260 | +8.7% | 100 |
| London | 3,550 | 3,625 | +2.1% | 8,395 | 9,560 | +13.9% | 264 |
| South East | 5,340 | 5,030 | −5.8% | 4,820 | 5,220 | +8.3% | 104 |
| South West | 4,255 | 4,015 | −5.6% | 3,220 | 3,515 | +9.2% | 88 |
| Wales | 2,190 | 2,005 | −8.4% | 1,380 | 1,605 | +16.3% | 80 |
| Scotland | 2,855 | 2,540 | −11.0% | 2,820 | 2,975 | +5.5% | 117 |
| Northern Ireland | 790 | 745 | −5.7% | 725 | 695 | −4.1% | 93 |
| United Kingdom | 39,145 | 37,350 | −4.6% | 35,105 | 38,735 | +10.3% | 104 |
Select any column heading to sort the table. Select it again to reverse the order. Counts are rounded to the nearest 5 by ONS.
What this means if you run a pub or restaurant
The figures count sites. They don’t record why a pub closed or a restaurant opened, so treat any single explanation with care.
They do show where the competition sits. If you run a pub in London, Scotland or the South East, a licensed restaurant is now a more common neighbour than another pub. In Yorkshire, the Midlands and the North East, pubs still have the numbers.
Each site is classed by its main activity. Some pubs that now take most of their money from food may be registered as restaurants, so part of this shift could be pubs changing what they are rather than closing.
More from this research
- The UK has lost 7,330 pubs since 2010A year-by-year look at the long decline and the worst years for closures.
- Scotland and Wales are losing pubs fastestThe regions where pub numbers have fallen furthest, and how every region compares.
- London is the only region with more pubs than in 2019How the capital has bucked the trend.
- Wales leads UK restaurant growthUp 16% since 2019, ahead of the North West and London.
Questions about the figures
How many pubs are there in the UK?
There were 37,350 pub and bar sites in the UK in March 2026, according to ONS UK Business Counts. That’s down from 44,680 in 2010.
How many restaurants are there in the UK?
There were 38,735 licensed restaurant sites in March 2026, up from 27,885 in 2010. The figure doesn’t include unlicensed restaurants, cafés or takeaways, which ONS counts separately.
Which part of the UK has lost the most pubs?
Scotland has seen the steepest fall. It had 315 fewer pubs in 2026 than in 2019, down 11%. The South East lost 310, level with Scotland within ONS rounding, but from a much larger base.
Are pubs that serve food counted as pubs or restaurants?
Each site is classed by its main activity. A food-led pub could be counted as either, depending on how the business is registered.
Why do other sources give different pub numbers?
Different organisations count pubs in different ways. Tax firm Ryan counted 38,623 pubs in England and Wales at the end of 2025, including empty pubs still liable for business rates, as the Morning Advertiser reported. The Scottish Beer and Pub Association puts Scotland’s total at around 4,380, according to the same publication. ONS only counts businesses registered for VAT or PAYE, classes each site by its main activity and rounds to the nearest 5, so its totals are lower. All the sources agree on the direction: pub numbers are falling.
Can I use these figures?
Yes. Please credit Homefords and link to this page. You can download the full data below. The underlying ONS data is available under the Open Government Licence.
How we worked out the numbers
The figures come from ONS UK Business Counts, which is drawn from the Inter-Departmental Business Register. We used local units, meaning individual business sites, so a pub company with 50 sites counts as 50. We used the release published on 24 September 2026, which covers March of each year from 2010 to 2026.
Pubs are sites classed under SIC 2007 code 56302, public houses and bars. Restaurants are sites under code 56101, licensed restaurants. Unlicensed restaurants, cafés and takeaways have their own codes and aren’t included.
Only businesses registered for VAT or PAYE appear on the register. ONS rounds counts to the nearest 5, so small gaps, such as the 10-site difference in the East, fall within rounding.
ONS added about 105,000 PAYE-only businesses in 2015, so comparisons starting before then aren’t like for like. Our main comparison, 2019 to 2026, is unaffected.
Contains public sector information licensed under the Open Government Licence v3.0. Source: Office for National Statistics, UK Business Counts, via Nomis.
Using these figures
You’re welcome to use any figure on this page in your own reporting. Please credit Homefords and link to this page as the source.
Suggested credit: Homefords analysis of ONS UK Business Counts, 2026. https://homefords.co.uk/restaurants-outnumber-pubs/
Download the full dataEvery region, every year from 2010 to 2026, for pubs and licensed restaurants. Includes the regional comparison, UK trend and methodology notes.
Download the data (Excel)Media enquiries, interviews and regional breakdowns: hello@homefords.co.uk
Refitting a pub or restaurant?
Homefords supplies tablecloths, napkins, cushions, curtains and blinds to hospitality venues across the UK. You don’t need a trade account, there’s no minimum order and delivery is free on orders over £100.